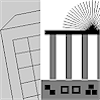
Your display is now 200 by 200.
Emphasize the difference between your early 100 by 100 display area and the now larger 200
by 200 display area with a statically motivated graphic.
#
# because of the increased space, i could divide my
# compositioninto three parts.  two showed some of mit's
# landmarks: thegreatdome and the green building.  the other
# graphicallyrepresents"2003", my graduation year.

import math
g.paper(0)

def rect(x1,y,x2,r):
 for m in range(0,r):
  g.line(x1,y+m,x2,y+m)

# background shading
g.pen(50)
rect(82,0,201,40)
g.pen(20)
rect(0,0,80,201)

# 2003
g.pen(100)
rect(90,20,100,10)
rect(100,10,110,10)
rect(122,12,138,16)
rect(145,12,161,16)
rect(185,10,195,10)
rect(172,10,182,10)
rect(178,21,188,10)
g.pen(50)
rect(126,16,134,8)
rect(149,16,157,8)

# great dome
for m in range(0, 31):
 g.pen(100)
 angle = (m /30.0) * math.pi
 radius = 60
 x = int(186 + math.cos(angle)*radius)
 y = int(140 + math.sin(angle)*radius)
 g.line(186, 140, x, y)
rect(90,131,201,10)

g.pen(50)
rect(100,41,112,90)
rect(132,41,144,90)
rect(164,41,176,90)
rect(196,41,220,90)

# green building
g.pen(100)
g.line(25,0,0,140)
g.line(0,140,80,155)
g.line(0,140,30,170)
g.line(30,170,80,180)
g.line(25,120,80,130)
g.line(25,120,47,0)
g.line(55,125,77,0)
g.line(30,92,80,101)
g.line(35,62,80,71)
g.line(41,32,80,41)
g.line(46,2,80,10)


