|
overview
+ development
quicktime movie:
3.5
MB | 6.0
MB
|
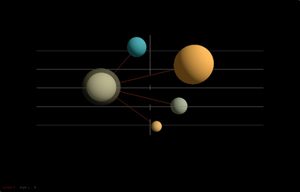
The project to
date has worked toward visualizing the quantitative data elements of
a system. The image above shows the current data values for five separate
elements in a hypothetical composition. In this example, each element
is represented as a sphere and has three values associated with it.
These values are presented as the x-coordinate, z-coordinate, and the
size of each sphere. The color communicates the potential energy for
the increase of a value according to the system definition. The spherical
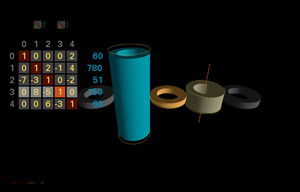
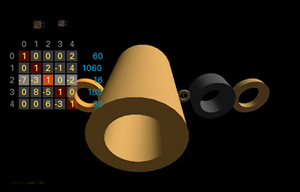
representation proved problematic so another form, the pipe, was chosen.
Using the height, and interior/exterior radius values for the presentation
of the data, the state of the system could be quickly and accurately
determined. The addition of the matrix element was added as a holistic
visualization of the system.
|